NASA Space Apps Challenge
Know your soil.
Choose your next crop with confidence.
VoidHarvest is designed to turn NASA Earth observations into plain answers for farmers: which rotation to try, when to plant, and where to check the ground first.
Prototype with demonstration data. Nothing has been retrieved from NASA or measured on a farm yet.
Preparing your farm
Preparing your farmConceptual schematic: the demo farm's parcels, crop rows and sampling points. Illustrative, not a real map.
The challenge
Farmers decide with too little information
Choosing a rotation is a bet on rain, soil and prices. Better information would make it a smaller bet.
01
The seasons are harder to read
Rain arrives late, stops early or comes in a few heavy storms. Rules of thumb that worked for years are less reliable.
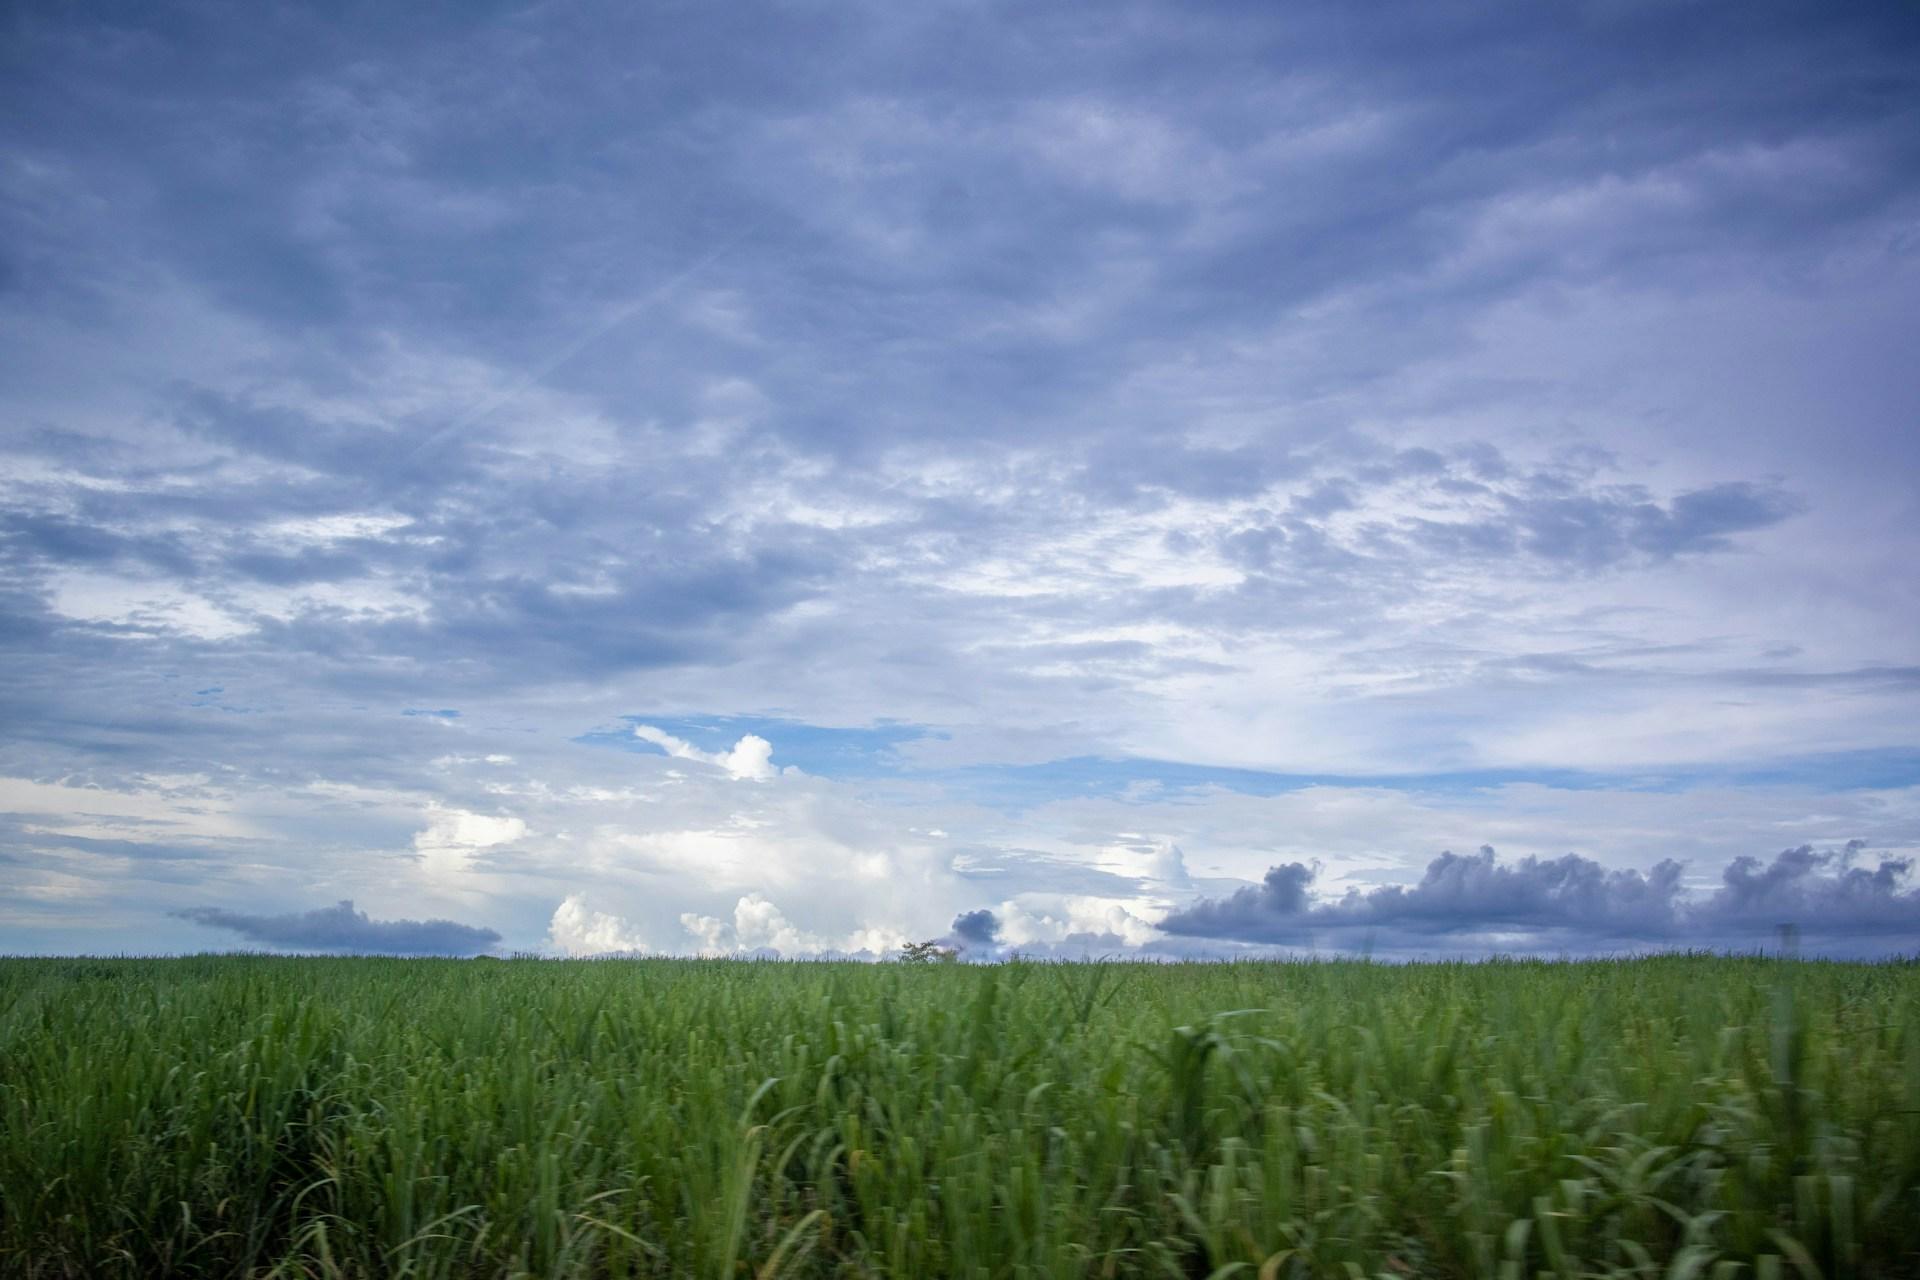
Photo: Javier Garcia Chavez, Unsplash 02
The soil hides what matters
Moisture 30 cm down decides if roots survive a dry spell, yet you cannot see it from the surface or from space.
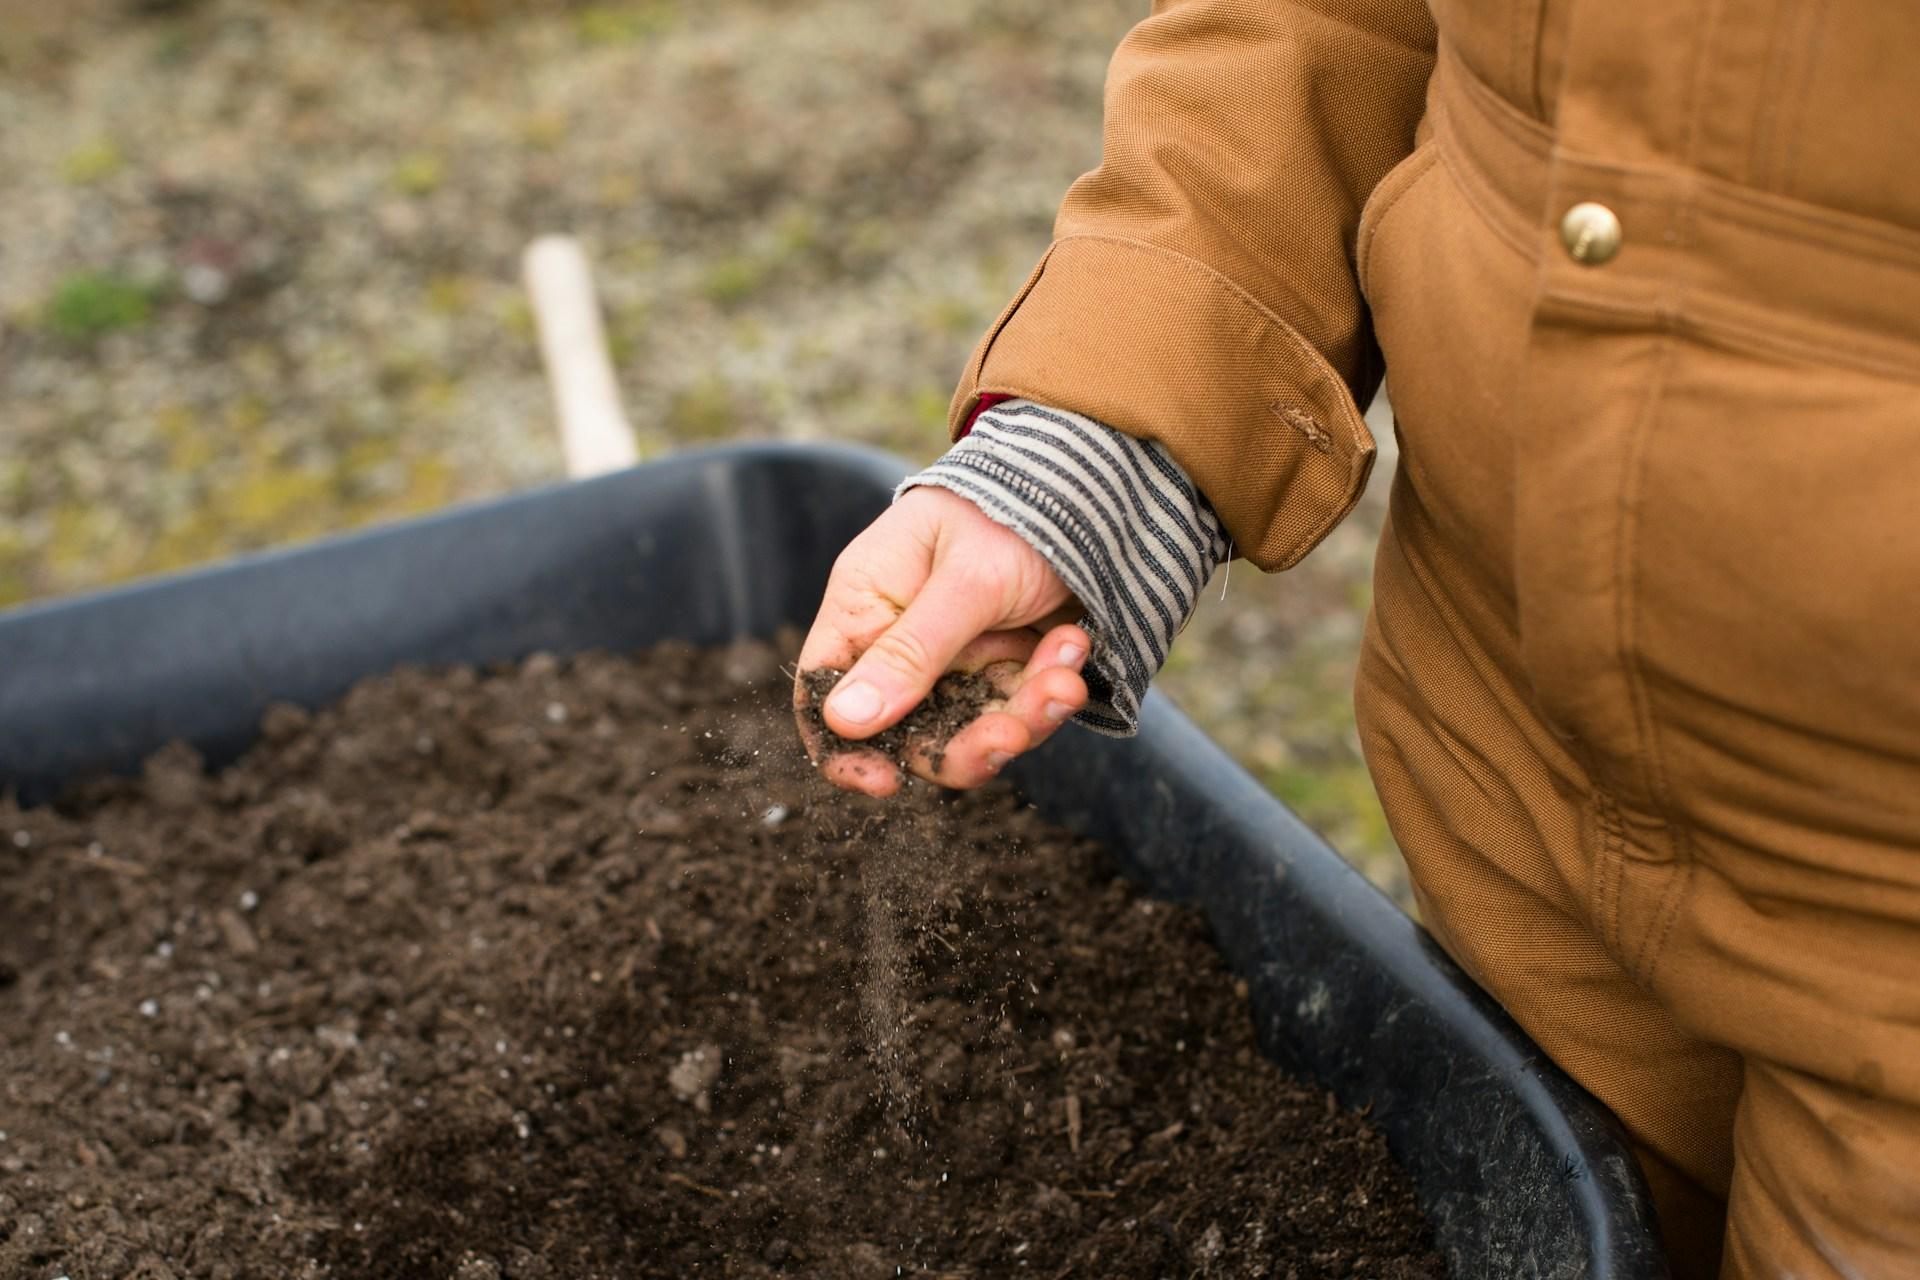
Photo: Zoe Schaeffer, Unsplash 03
The data is scattered and technical
Satellite products exist, but they come in formats and units made for scientists, not for the person choosing what to plant.
Photo: NASA, via Unsplash
Preparing your farm
Preparing your farmShowing: Your farm. Five zones drawn from the farm description. Schematic, not a map. Conceptual demonstration, not retrieved data.
Your farm
Five zones drawn from the farm description. Schematic, not a map.
Conceptual demo. Not retrieved data.
How it works
From satellite context to a decision in five steps
Steps marked Demo exist as screens today. Steps marked Planned are the next build.
01 / 05
Describe your farm
Crop, slope, soil and what you want to protect: water, income or soil.
Demo
02 / 05
Gather NASA context
Rain, soil moisture, heat, greenness and slope are meant to arrive from NASA Earth observation layers.
Planned source
03 / 05
Check the ground
Five zones, five points each. Moisture at the surface and at 30 cm shows what satellites cannot.
Planned
04 / 05
Compare rotations
Crop-water results for each strategy are meant to come from a backend model. Today they are shown as a demonstration.
Demo
05 / 05
Decide and learn
Pick a rotation and a planting window, then compare what satellites said with what the ground showed.
Planned
NASA-powered intelligence
Six NASA layers, each answering a farmer's question
These are the datasets VoidHarvest plans to use. No data has been retrieved yet: each view on the farm is a demonstration of how that layer would look.
SMAP
Soil Moisture Active Passive
Is the soil wet or dry right now, and is it drying fast?
Big coarse cells: the whole farm sits inside a few pixels. Blue is wetter, sand is drier.
- Measures
- Surface and root-zone soil moisture
- Detail
- ~9 km
- Updates
- Every 2–3 days
Planned NASA source · demo visualizationGPM IMERG
Global Precipitation Measurement
How much rain fell, and did it come in a few heavy storms?
Rain as soft storm cells, one heavy and one light. It tells you a storm happened, not which field got it.
- Measures
- Rainfall estimates
- Detail
- ~10 km
- Updates
- Every 30 minutes
Planned NASA source · demo visualizationPOWER
Prediction Of Worldwide Energy Resources
Is it hotter or sunnier than usual for this crop stage?
An even coarser grid with sun and warmth. One value covers the farm: useful for the season, not for a zone.
- Measures
- Sunlight, temperature, humidity, wind
- Detail
- ~50 km grid
- Updates
- Daily
Planned NASA source · demo visualizationHLS / MODIS
Harmonized Landsat Sentinel-2 and MODIS
Are my plants growing as green and fast as they should?
A fine mosaic of greenness. Healthy rows show dense green, stressed ones fade towards straw.
- Measures
- Crop greenness (vegetation index)
- Detail
- 30 m (HLS) · 250 m (MODIS)
- Updates
- Every 2–5 days (cloud permitting)
Planned NASA source · demo visualizationECOSTRESS
ECOsystem Spaceborne Thermal Radiometer Experiment on Space Station
Are my plants running hot, a sign they are short of water?
Surface heat in medium pixels. Plants that cannot drink enough run hotter than their neighbours.
- Measures
- Plant and land surface temperature
- Detail
- ~70 m
- Updates
- Irregular passes
Planned NASA source · demo visualizationSRTM
Shuttle Radar Topography Mission
Where does water run off, and where does it collect?
Contour lines and a height tint from the same terrain: water runs downhill and collects in the low edge.
- Measures
- Elevation and slope
- Detail
- ~30 m
- Updates
- Static (2000)
Planned NASA source · demo visualization
Resolutions are nominal product specifications. Satellites see wide areas and the soil surface, which is why VoidHarvest pairs them with local readings at 30 cm.
Under the surface
What satellites cannot see
Satellites read the top of the soil. Roots live deeper. That is why VoidHarvest plans a second reading at 30 cm, at the same points, so the ground can confirm or contradict the sky.
- Blue pin: reading at the surface, where satellites can see.
- Orange pin: reading at 30 cm, below where they cannot.
Preparing your farm
Preparing your farmSee what a field decision could look like
Explore the demo farm, or create an account and build your own before you enter Farm Intelligence.
Prototype with demonstration data. No real accounts.